The Trap
Door count is the number the category talks in. The distributor’s deck has it. The investor’s first question is some version of it. When you are in 500 stores and a competitor is in 2,000, it is hard not to hear that as a score. So when the distributor offers to take you from 500 to 2,000 in two quarters, saying yes feels like the obvious move. Every door is a chance to sell.
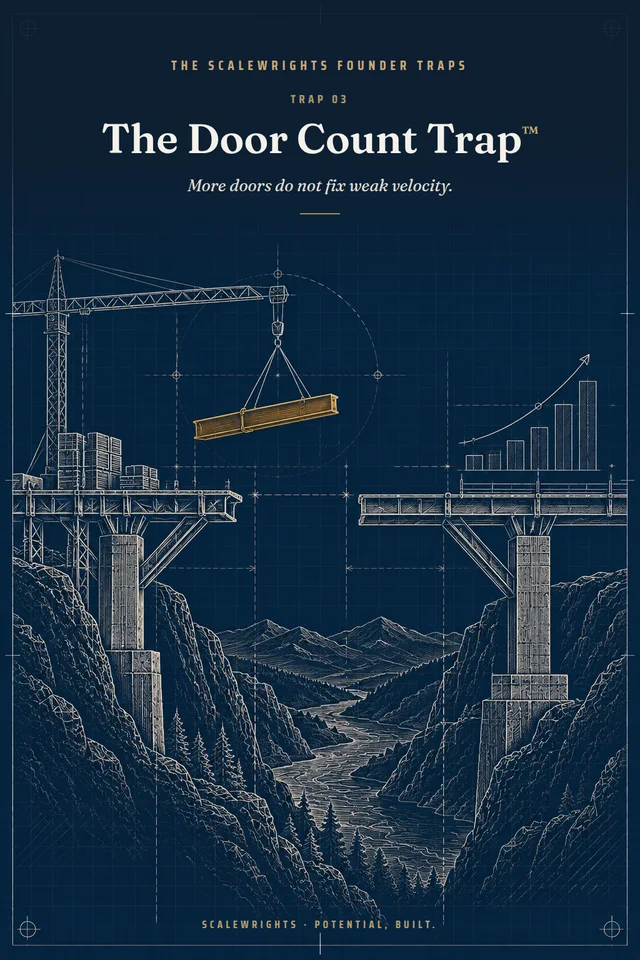
The Door Count Trap™ is what happens when distribution grows faster than demand. Law IV — Success Can Kill the Company™ — has the line: doors are not demand. Distribution is the opportunity to prove demand. A door where the product moves one unit a week is not a small success. It is a small, recurring loss, with your inventory in it.
The reason this catches good founders is that door growth is the one form of growth you can buy. Velocity has to be earned in the store, one shopper at a time, and it is slow. Doors come with a signature. It is natural to reach for the thing you can control.
The tell
- You know the door count to the store and the velocity to one decimal only when the distributor sends it.
- Average velocity has fallen every quarter that doors have risen.
- The free-fill and slotting budget grew faster than revenue last year.
- More than a quarter of your doors sit below the velocity the retailer resets at.
- The distributor’s next expansion is on the calendar and the last one’s sell-through is not.
The arithmetic
A supplement with $1.20 of contribution per unit after variable costs. Each door costs about $95 a year to hold — the free-fill case, the broker visit, a share of the merchandiser, and slotting amortized over the year. That means the break-even velocity per door is $95 ÷ (52 × $1.20), or 1.5 units a week. Below that, a door costs more than it earns.
Compare the two plans over a year.
| 500 doors | 2,000 doors | |
|---|---|---|
| Velocity (units per door per week) | 4.0 | 1.1 |
| Units a year | 104,000 | 114,400 |
| Contribution at $1.20 | $124,800 | $137,280 |
| Door cost at $95 | $47,500 | $190,000 |
| Contribution after door cost | $77,300 | −$52,720 |
The 2,000-door plan moves 10 percent more units and earns $130,020 less. It also ships 36,000 units of pipeline fill into the new doors before a single one is sold, which is inventory you own until the retailer decides otherwise, and most of those doors are below the line the retailer resets at. In six months a third of them will be gone, with the product returned or marked down, and the distributor will describe the brand as one that “didn’t perform.”
That is the Success Tax™ on a distribution win: inventory, free fills, chargebacks, returns, a broker to keep 2,000 stores in stock, and a reputation in the category that is harder to rebuild than it was to build. Law IX — Motion Is Not Progress™ — would call the second column motion.
The fix
Law IV’s rule is velocity before distribution. Earn the units per store per week first, then spend the doors on it. The instrument is a velocity tracker: a row per door, four weeks of units, the average, the quartiles, and a count of doors below the line. That count is the number that should decide the next expansion.
Run the Success Gate™ on the 2,000-door offer. What is the revenue opportunity? What is the Success Tax? What is true contribution after door cost? What becomes the new constraint — cash for free fills, or the broker’s capacity? Can the commitment be staged?
The Gate answer this usually produces is GO SMALL. Take the next 200 doors, in one region, in the account type where you already run above 3.0, and let them prove the number before the distributor sells the rest. Principle 08 — Not Yet Is an Answer™ — is not a refusal. It is a rate.
Compute your break-even velocity per door this week — door cost divided by 52 times contribution per unit — and write it where the sales team can see it.
Build the tracker: every door, four weeks of units, and the count below the line, updated by the 10th of each month.
Set a rule before the next expansion: no new doors in an account type where the existing doors average under two times break-even.
The First Batch™ Workbook’s Template 7, 07_Velocity_Tracker.xlsx, is the row-per-door tracker with the average, the quartiles, the count below the line, and the weeks of cover the first PO buys. Template 2, 02_COGS_and_First_Price.xlsx, computes contribution per unit by channel and the break-even velocity per door. Once you have a distributor and a growth plan, the Build Line™ Workbook’s Template 16, 16_GTM_Engine.xlsx, carries new-door economics by distributor and region with the velocity floor built in. Start with the check at /build-line.html.
SCALE — this trap belongs to The Build Line. Take the check at /build-line.html.
Take the Scale Readiness Check →