The Trap
Revenue is the number everyone can see. Your team sees it. Your board sees it. The trade press sees it. When someone asks how the company is doing, revenue is the answer that comes out of your mouth before you have decided to say it. So you build the company that makes the number go up. That feels rational, because for a while it is.
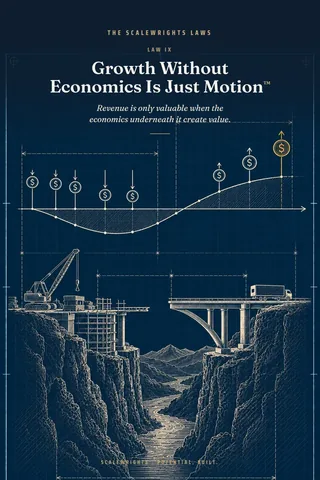
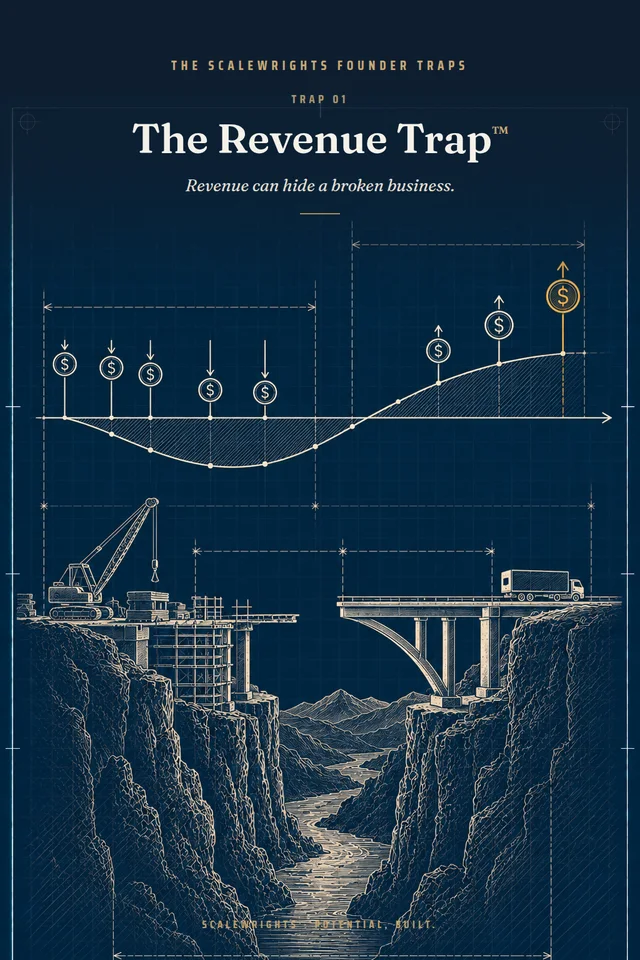
The Revenue Trap™ is what happens when the top line grows and the business underneath it gets worse. Margin thins. Working capital swells. Trade spend rises. The founder makes more decisions, not fewer. The company is bigger. It is not better. Law IX — Motion Is Not Progress™ — says the same thing in one line: bigger and better are not synonyms.
The reason smart founders fall into it is that the revenue is real. The purchase orders are real. The pallets leave the warehouse. Nobody is lying. The trap is that revenue answers one question — how much product moved — and you have been treating it as the answer to a different one: what the movement was worth.
The tell
- Revenue is up more than 50 percent and contribution dollars are up less than 10 percent.
- You know gross margin by company and cannot say contribution by channel or by customer.
- Trade spend, deductions, and chargebacks are booked wherever the bookkeeper found room for them.
- The new account is the one your team is proudest of and the one that pays slowest.
- Cash is tighter this year than last year, and revenue is the reason you give.
The arithmetic
Take a supplement at a $4.99 shelf price, sold through a distributor into a national chain. Follow one unit from the shelf to your bank. This is the Economic Truth Stack™.
| Line | Per unit |
|---|---|
| Shelf price | $4.99 |
| Retailer margin (35%) | −$1.75 |
| Retailer’s cost — what the distributor invoices | $3.24 |
| Distributor margin (25%) | −$0.81 |
| Your invoice to the distributor | $2.43 |
| Trade spend (15% of invoice) | −$0.36 |
| Broker (5%) | −$0.12 |
| Freight to the distributor | −$0.18 |
| Deductions and chargebacks (3%) | −$0.07 |
| Landed COGS | −$1.45 |
| Contribution | $0.25 |
A $4.99 unit returns $2.43 of revenue and 25 cents of contribution. Now put 2,000,000 units through that stack in a year. Net revenue: $4,860,000. Contribution: $500,000. Servicing the account takes an EDI system and a person to fight the deductions — call it $180,000 — and the first-year slotting was $150,000. The account nets $170,000.
Before the account, the company did $6,000,000 at 38 percent contribution, or $2,280,000. After it, the company does $10,860,000. Revenue is up 81 percent. Contribution is up to $2,450,000 — 7 percent. And because the chain pays net-60 and you carry 45 days of inventory for it, about $1,400,000 of working capital is now parked in the account at any given moment, earning that $170,000. That is a 12 percent Return on Working Capital™, before anyone counts the founder’s hours.
The story you tell is “we nearly doubled.” The Economic Waterfall™ — Revenue → Gross Profit → Contribution → Operating Profit → Free Cash Flow — tells the story the buyer will read. Principle 02 — Worth More Than It’s Getting.™ — is about companies that are better than the market can see. This one is the reverse: a company that looks better than it is, until someone runs the stack.
The fix
Law IX’s rule is that every dollar of revenue has to justify the capital, complexity, and risk it took to produce it. So run the Economics Gate™ on the account, not on the company. What is true net revenue? What is true contribution? What working capital does it hold? How fast does that capital come back? What is the alternative use of $1,400,000?
Then grade the revenue. Quality of Revenue™ has seven marks: contribution, repeatability, cash conversion, concentration, service burden, promotion dependence, and strategic fit. A 25-cent unit on net-60 that needs a full-time deductions analyst scores low on five of them.
The Gate answer this usually produces is NOT THIS — not the account as structured. GO SMALL if the same chain will take a regional test at better terms, fewer SKUs, and a trade rate you can measure. The revenue you keep should make the company stronger, not just larger.
Build the Economic Truth Stack for your three largest accounts this week, one column each, down to contribution per unit.
Restate last year’s P&L by channel with contribution, and find every dollar of trade spend and deductions, by the end of the month.
Set one number — Return on Working Capital by account — and refuse any new account below 25 percent until it has earned its way up.
The Build Line™ Workbook’s Template 7, 07_Management_Report_Pack.xlsx, carries the P&L by channel with contribution and the 13-week cash forecast beside it — the two pages that catch this trap before the year is over. Template 13, 13_Margin_Stress_Test.xlsx, runs contribution by channel through the three shocks. If a buyer is already in the picture, the Summit™ Workbook’s Template 4, 04_Quality_of_Earnings.xlsx, is the page their team will build from your numbers whether you build it first or not. Start with the check at /build-line.html.
SCALE — this trap belongs to The Build Line. Take the check at /build-line.html.
Take the Scale Readiness Check →