The Principle
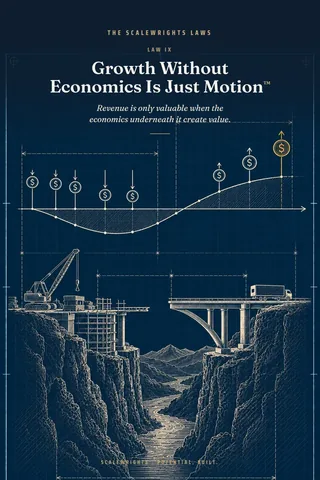
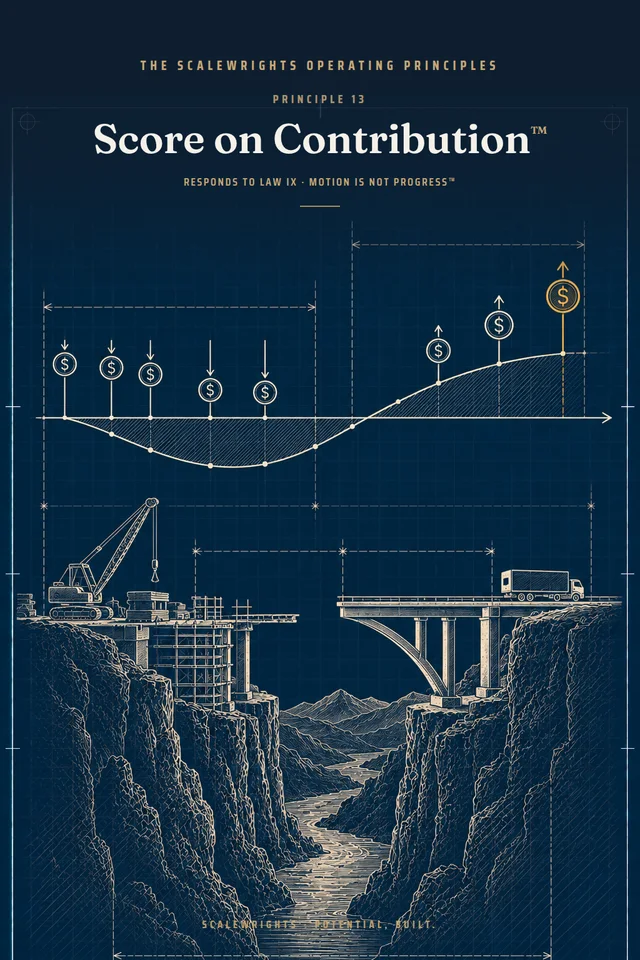
This is how I want you to operate under Law IX — Motion Is Not Progress™: measure the company by contribution, and let contribution, not revenue, decide where the next unit of effort goes.
Revenue is the number everyone can see. It is on the first slide, in the press release, in the sentence you use when someone asks how the company is doing. It is also the beginning of the question, not the answer. “We did $20,000,000” tells me how much product moved. It does not tell me what the movement was worth: at what gross margin, after what trade spend, with what working capital tied up for how long, at what concentration, and with how much cash left when the quarter closed.
I am not asking you to care less about revenue. I am asking you to stop scoring on it.
Walk down from the shelf
Start at the shelf and walk down. Shelf price, minus the retailer’s margin, minus the distributor’s margin, minus trade spend, minus broker and selling expense, minus freight and logistics, minus landed cost, equals contribution. That is the Economic Truth Stack™, and the number at the bottom is the first one that is yours.
Build it for every channel. Two channels can report the same gross margin while one needs heavy promotion, 60-day terms, deductions, dedicated freight, and two people to service it. Gross margin is not lying; it is answering a narrower question than the one you asked. Contribution answers the real one: after everything it took to make the sale, what is left to pay the overhead, fund the growth, service the debt, and produce the cash?
Rank the company by the bottom line of the stack
Once the stack exists, sort by it. Channels by contribution, not revenue. Customers by contribution, not volume. SKUs by contribution per unit and per dollar of working capital, not by cases shipped.
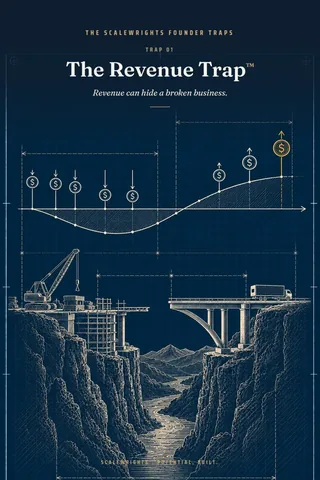
The ranking will surprise you. The largest customer is often not the most valuable one; Trap 01 — The Revenue Trap™ is a company that never ran this sort. The channel that produces the most press produces the least cash. The SKU the salesforce loves is the one that ships free. None of that is an argument to stop selling. It is the map of where the next dollar of effort earns the most, and where it earns nothing.
Ask what the capital behind the sale returns
Two businesses with the same contribution are not the same business if one needs twice the inventory and receivables to produce it. Return on Working Capital™ asks how much contribution the company generates relative to the working capital required to support it.
A product with a lower margin and faster turns can produce more economic output from the same dollar than a higher-margin product that sits on the shelf. Cash Velocity™ belongs to Law III — Growth Eats Cash First™; it belongs here too. Compute the return on the working capital behind your three largest customers. A buyer’s model will, whether or not you have.
Volume does not repair negative contribution
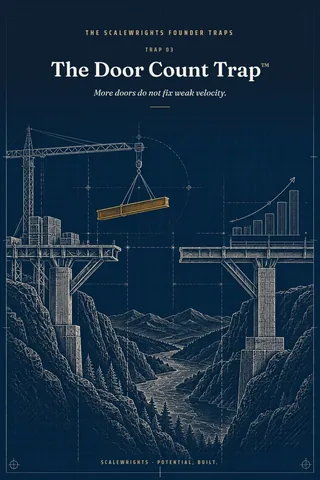
If a channel loses money on every unit after trade, freight, and deductions, more units lose more money. “We will make it up on volume” is arithmetic that only works when the thing being multiplied is positive. Trap 03 — The Door Count Trap™ is this sentence with a distributor attached: more doors do not fix weak velocity; they distribute it.
Before you add volume to anything, prove the unit is positive. If it is not, fix the price, the terms, the freight, or the promotion first, or decline the volume.
Build in a Margin of Safety™
Forecasts are wrong. Ingredients rise. Freight rises. A promotion gets cut. A retailer negotiates. A model that works only when every assumption is perfect is a hope with a spreadsheet.
Put a Margin of Safety on the price ladder before it is needed: contribution that survives a 10 percent increase in inputs and freight, a lost promotion, and a slow quarter, all at once. Then set price and terms so that the margin survives, and hold them. The Margin of Safety is what lets the company say no to the customer who wants the last two points.
Read the whole waterfall
Revenue, gross profit, contribution, operating profit, free cash flow. The Economic Waterfall™ is five levels, and each answers a different question: are we selling, does the product carry margin, does the sale create room, does the enterprise make money, and does the business produce cash it can deploy?
Most founders can answer the first without looking. Few can answer the last without a pause. Read the whole waterfall every month, in the same format, and treat the pause as the diagnosis. EBITDA is not cash. Only the last level pays anyone.
Grade the quality of the revenue you keep
High-quality revenue looks the same wherever it appears: strong contribution, repeatability, good cash conversion, low concentration, low service burden, low promotion dependence, high strategic fit. Low-quality revenue can be the same size and look identical on the top line.
Quality of Revenue™ is the discipline of telling them apart, and of growing the first kind on purpose. A buyer will grade it in the first hour. Grade it first.
Run the Economics Gate™
Before the next channel, customer, promotion, or production run, ask: What is true net revenue? What is true contribution? What working capital does it require, and how quickly does it return? What fixed capacity must be added? What happens at scale, and what happens if volume is lower? What is the alternative use of the same cash and attention?
Then GO, GO SMALL, NOT YET, or NOT THIS. GO SMALL on a channel means one region until the stack is proven. NOT YET on a customer means fixing the terms before the first PO. NOT THIS is the answer for revenue that was never going to be worth what it cost.
The Scalewrights view
Bigger and better are not synonyms. The company that grows revenue while contribution falls is running faster toward a wall, and the founder who scores on revenue will not see the wall until the cash runs out.
Score on contribution. Then grow, in the channels and customers and SKUs where the arithmetic says growth is worth having. That is not caution. It is how a company gets larger and stronger at the same time.
Build the Economic Truth Stack for every channel this month, shelf price to contribution, and re-rank the channels by the bottom line.
Compute Return on Working Capital for your three largest customers within 30 days, and put the result beside their revenue in the next board pack.
Put a Margin of Safety on the price ladder before the next price decision: 10 percent on inputs and freight, plus the promotion you cannot count on.
The Build Line™ Workbook carries this Principle in Template 7, 07_Management_Report_Pack.xlsx, the P&L by channel with contribution, and Template 13, 13_Margin_Stress_Test.xlsx: contribution by channel, three shocks (input cost, price move, volume) with the price band per channel, and break-even velocity under load (scalewrights.gumroad.com/l/build-line). If you are earlier, the First Batch™ Workbook’s Template 2, 02_COGS_and_First_Price.xlsx, is the Economic Truth Stack at day one: the price ladder from the shelf to your bank with every margin, contribution per unit by channel, and break-even velocity per door (scalewrights.gumroad.com/l/first-batch).
SCALE · SELL — take the Scale Readiness Check at /build-line.html; a buyer rebuilds these numbers at /summit.html.
Take the Scale Readiness Check →